Kafka
Kafka Perf Test
marcel
2025. 3. 14. 11:06
Kafka Perf Test 란 Kafka 내부에서 임의로 트래픽을 발생시켜 순수하게 카프카의 처리량을 테스트할 수 있는 명령 스크립트입니다.
메세지의 사이즈와 수를 정할 수 있고, 전송된 메세지에 대한 처리량과 지연율 등을 확인할 수 있습니다.
명령어 정리
Producer Command
kafka-producer-perf-test.sh \
--topic <your-topic> \
--num-records <total-records> \
--record-size <record-size> \
--throughput <target-tps> \
--producer-props bootstrap.servers=<broker-list>
--producer.config config/producer.properties- Topic : 토픽명
- Num-records : 송신 메세지 총 개수
- Record-size : 메세지 당 크기
- Throughput : 전송 TPS ( -1 = 실시간성 / 1000 = 초당 1000개 등 )
- Producer-props → bootstrap-server : 브로커 클러스터 IP:Port
- Producer.config : 프로듀서에 대한 옵션들을 Properties에 기입 후 적용 (batch size, acks, Linger.ms 등)
Consumer Command
kafka-consumer-perf-test.sh \
--topic <your-topic> \
--group <consumer-group> \
--messages <total-messages> \
--threads <number-of-consumers> \
--bootstrap-server <broker-list> \
--consumer.config config/consumer.properties- Topic : 전송받을 토픽명
- Group : 가져올 Consumer Group
- Messages : 가져올 메시지 총 개수
- Threads : 가용할 Consumer 개수
- 실제 테스트 진행 시 Consumer의 개수는 개발 단계에서 대략적으로 정해진 Consumer 개수를 차용한다.
- bootstrap-server : 브로커 클러스터 IP:Port
- Consumer.config : Consumer에 대한 옵션들을 Properties에 기입 후 적용
테스트
- 본 테스트는 Perf Test의 사용 방법을 파악하는 것을 목적으로 한다.
- 이후, Partition 개수를 변경시키며 추가적인 성능 변화를 측정하는 것을 목적으로 한다.
Topic 정의
- Partitions : 3 , Replication-factor : 3
[kafka@kaf01 kafka_2.13-3.8.0]$ ./bin/kafka-topics.sh --bootstrap-server 10.65.41.102:9092,10.65.41.103:9092,10.65.41.104:9092 --topic cpu-topic --describe
Topic: cpu-topic        TopicId: RuiNKw0aRKC-8n7o6xBuVg PartitionCount: 7       ReplicationFactor: 3    Configs:
        Topic: cpu-topic        Partition: 0    Leader: 3       Replicas: 3,1,2 Isr: 1,2,3      Elr:    LastKnownElr:
        Topic: cpu-topic        Partition: 1    Leader: 2       Replicas: 2,3,1 Isr: 2,1,3      Elr:    LastKnownElr:
        Topic: cpu-topic        Partition: 2    Leader: 3       Replicas: 3,1,2 Isr: 1,2,3      Elr:    LastKnownElr:
Test Tools
- Kafka Bootstrap Server 및 Perf Test Scripts
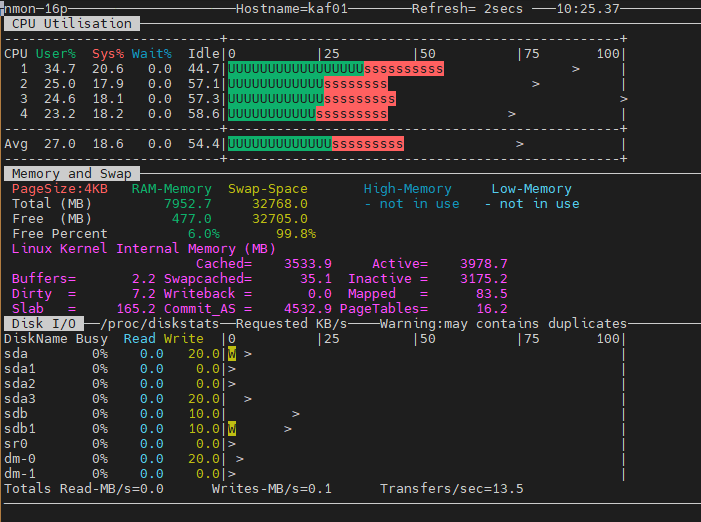
- nmon : CPU, Memory, Disk I/O 등의 부하를 측정할 수 있는 툴
Producer Test
- 10분간 3초마다 1만건의 메시지가 Producing 되는 스크립트
- 실시간으로 확인되는 Latency 및 Tps 지표를 통해 메시지가 Producing 될 때의 Kafka 성능을 확인할 수 있습니다.
$ vim producer_perf.sh
#!/bin/bash
# 시작 시간 (Epoch 초)
start_time=$(date +%s)
# 종료 시간: 시작 시간 + 600초(10분)
end_time=$((start_time + 600))
# 10분 동안 루프 실행
while [ "$(date +%s)" -lt "$end_time" ]; do
# Kafka 프로듀서 퍼포먼스 테스트 명령 실행
kafka-producer-perf-test.sh \
--topic "$TOPIC" \
--num-records 10000 \ # 전송할 메시지 개수 (1만 건)
--record-size 1000 \ # 각 메시지 크기 (1000바이트)
--throughput 10000 \ # 초당 전송 속도 제한 (여기서는 10000 msg/sec로 제한)
--producer-props bootstrap.servers=$BOOTSTRAP_SERVERS
--producer.config config/producer.properties
sleep 3
done
echo "10분간의 Kafka 메시지 전송을 완료했습니다."평균 테스트 결과
10000 records sent, 5494.505495 records/sec (5.24 MB/sec), 324.77 ms avg latency, 861.00 ms max latency, 327 ms 50th, 586 ms 95th, 663 ms 99th, 683 ms 99.9th5097 records sent, 1019.4 records/sec (9.72 MB/sec), 2002.2 ms avg latency, 2101.0 ms max latency.
10000 records sent, 5537.098560 records/sec (5.28 MB/sec), 309.15 ms avg latency, 816.00 ms max latency, 342 ms 50th, 575 ms 95th, 655 ms 99th, 671 ms 99.9th
10000 records sent, 5750.431282 records/sec (5.48 MB/sec), 299.25 ms avg latency, 748.00 ms max latency, 281 ms 50th, 556 ms 95th, 649 ms 99th, 675 ms 99.9th
10000 records sent, 5605.381166 records/sec (5.35 MB/sec), 297.39 ms avg latency, 915.00 ms max latency, 283 ms 50th, 565 ms 95th, 608 ms 99th, 615 ms 99.9th- 프로듀서 테스트 결과:
- 전송된 레코드 수: 10,000개
- 초당 평균 레코드 전송률: 약 5537개 (records/sec)
- 평균 대기 시간: 약 309.15ms
- 최대 대기 시간: 816.00ms
- 초당 전송 데이터량: 약 5.28 MB/sec
- NMON 모니터링
Consumer Test
[kafka@kaf01 kafka_2.13-3.8.0]$ bin/kafka-consumer-perf-test.sh   \
--topic cpu-topic  \
--bootstrap-server 10.65.41.102:9092,10.65.41.103:9092,10.65.41.104:9092  \
--messages 10000   \
--threads 5   \
--group perf-test-group   \
--consumer.config config/consumer.properties
결과
start.time, end.time, data.consumed.in.MB, MB.sec, data.consumed.in.nMsg, nMsg.sec, rebalance.time.ms, fetch.time.ms, fetch.MB.sec, fetch.nMsg.sec
2025-03-11 22:59:42:103, 2025-03-11 22:59:44:666, 95.3674, 37.2093, 10000, 3901.6777, 787, 1776, 53.6979, 5630.6306- 컨슈머 테스트 결과:
- 수신된 메시지 수: 10,000개
- 초당 평균 메시지 수신률: 약 3,902개 (nMsg/sec)
- 데이터 처리량: 약 37.21MB/sec
추가 정리
- 본 테스트를 통해 해당 서버의 Kafka Cluster의 성능을 대략적으로 파악할 수 있으나, 외부 네트워크를 사용하는 경우 지연이 조금 더 발생할 수 있다.
- Partition 개수가 많아질수록 여러 브로커에 메시지가 분산되므로 처리량(Throughput)의 증가를 기대할 수 있다.
- 다만, Partition 개수가 너무 많아지면 메타데이터 관리 증가 등의 문제로 오버헤드가 증가한다.
- CPU 및 DISK I/O 사용량 증가